Observability
The Observability tab is where a service tells you how it's doing. It has six sections: Monitoring, its traffic, response time, error rate, uptime and resource use over a range; Events, its uptime probes, live logs, failed deploys and the errors Homerun logged about it; Errors, the exceptions your app reports (see Error tracking); Traces, its OpenTelemetry traces (see Tracing); Pipelines, the CI runs of the repository linked to it (see Pipelines); and Health, the healthcheck the running container was created with (see Services).
#Monitoring
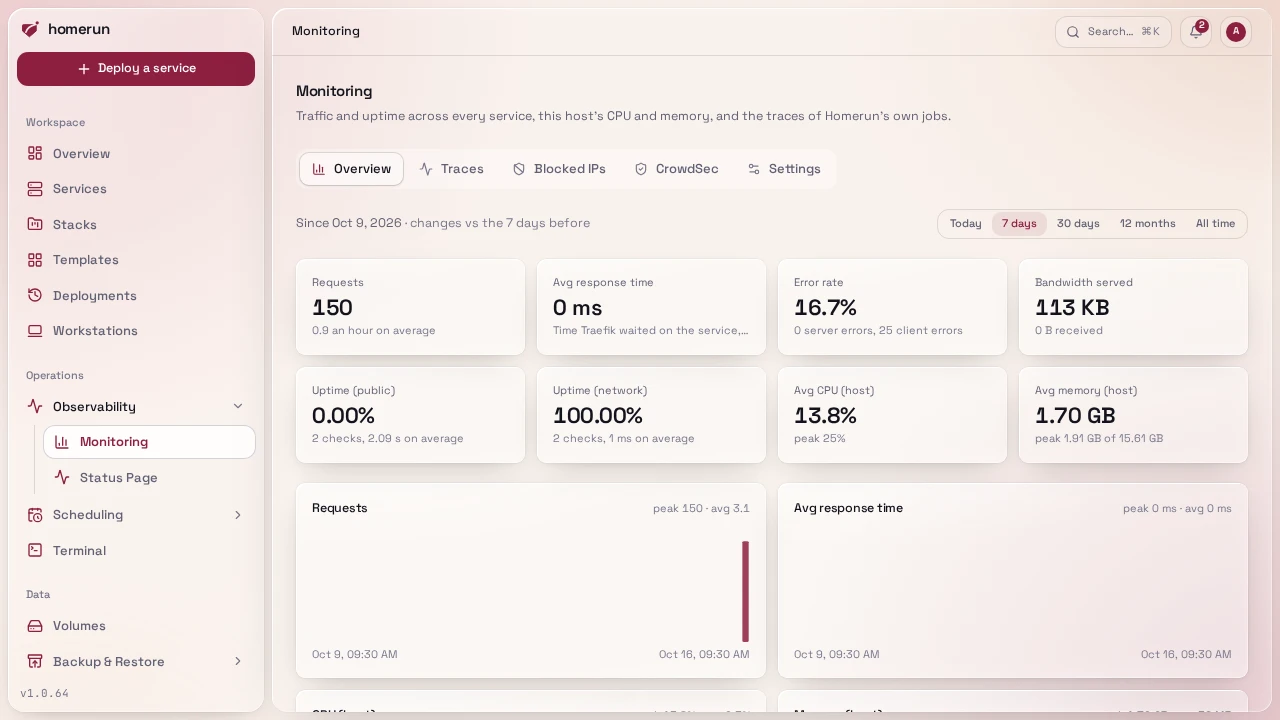
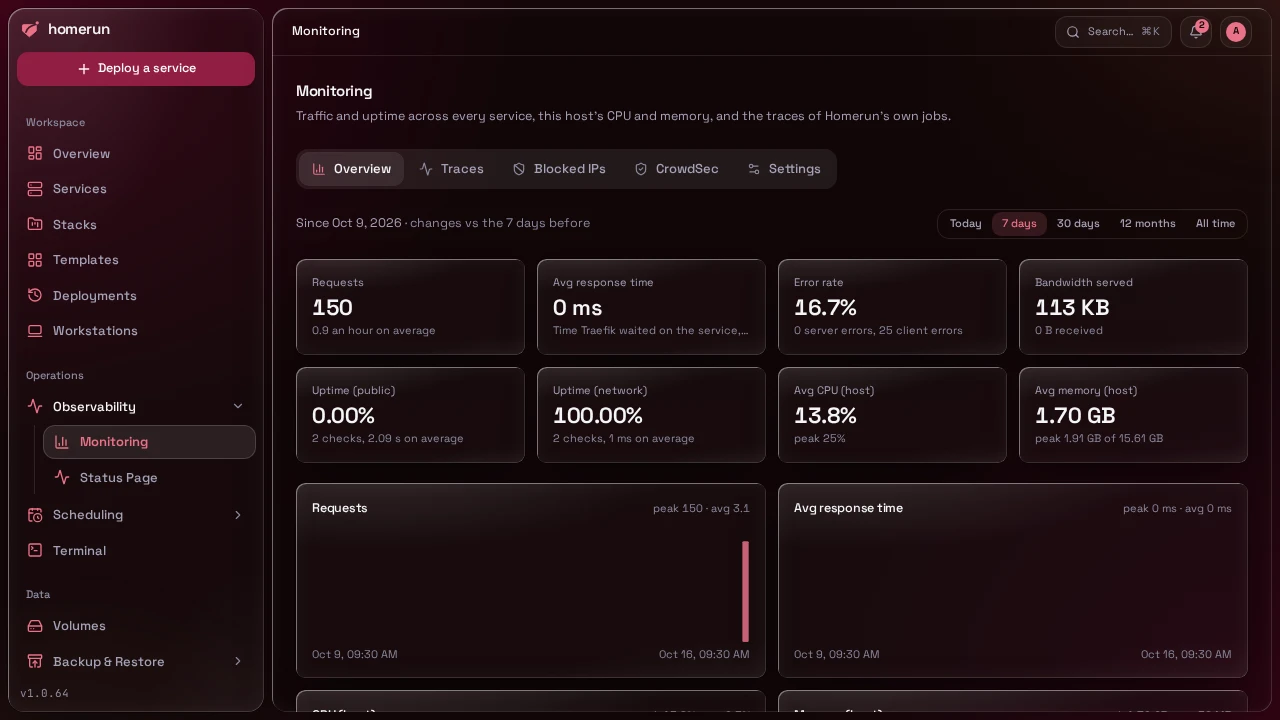
Pick a range, Today (from midnight in your browser's time zone), 7 days, 30 days, 12 months or All time, and the section shows:
- Requests, Avg response time, Error rate (4xx and 5xx responses) and Bandwidth served, from Traefik's own metrics. Homerun reads them once a minute and keeps what each service served that minute; a minute without requests stores nothing. The response time is how long Traefik waited on the service, so it leaves out the visitor's own network. Only publicly routed services have traffic: a service reached only over the Docker network never goes through Traefik.
- Uptime (public) and Uptime (network): the share of uptime probes that passed in the range, with their average latency.
- Avg CPU and Avg memory, with their peaks, from the per-minute resource samples.
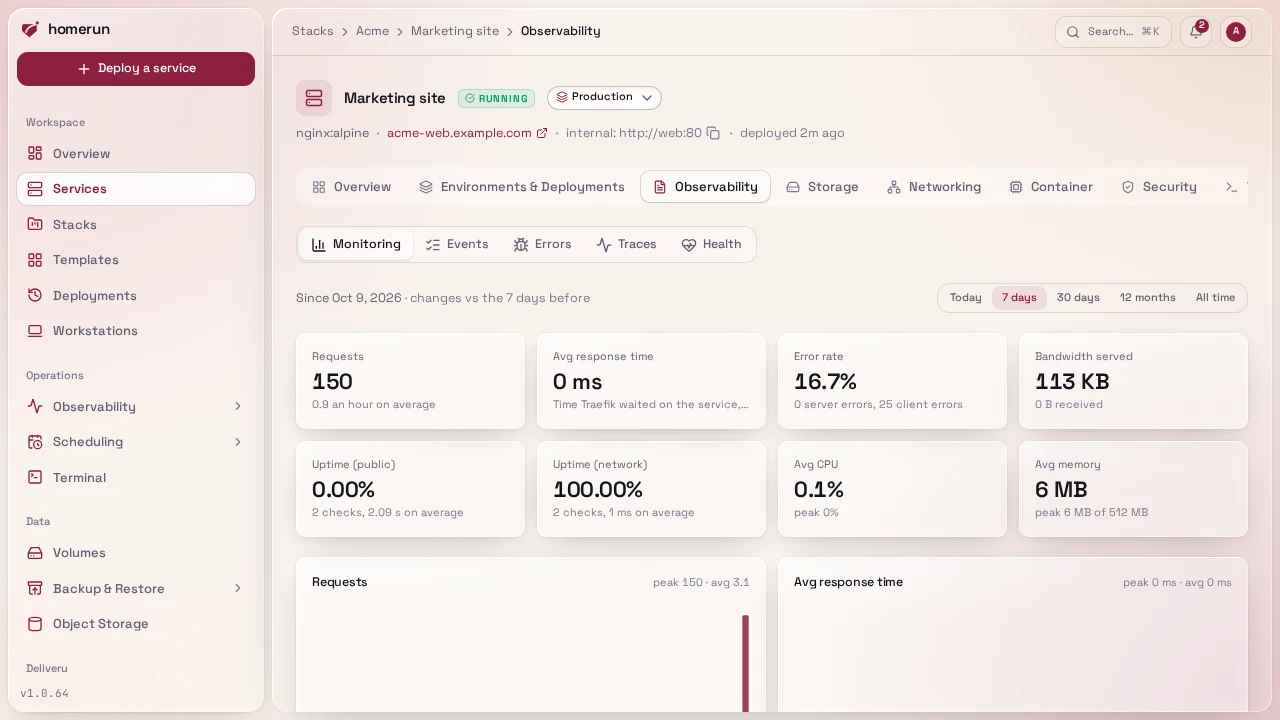
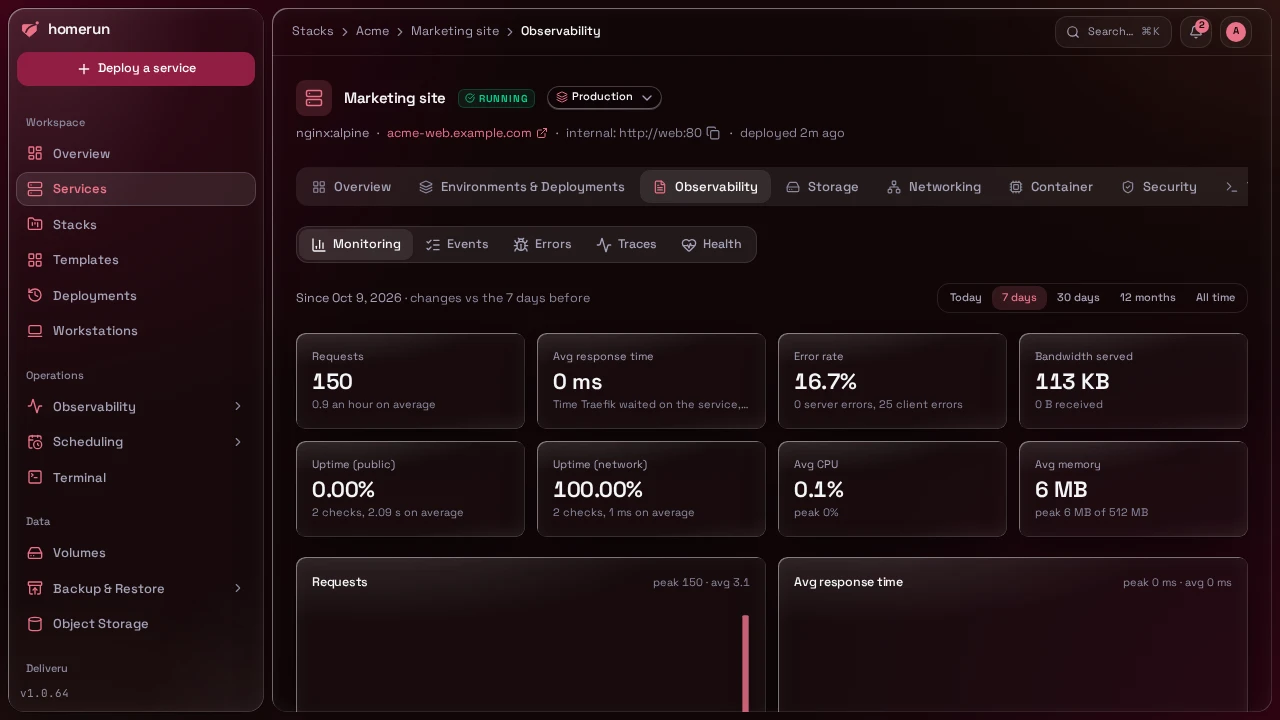
Each number also shows how it moved against the previous period of the same length: yesterday up to the same time for Today, the 7, 30 or 365 days before for the others (All time has nothing to compare with). The change is green when it's good news, red when it isn't (a slower response time, a higher error rate, lower uptime, more CPU or memory) and grey when it's neither (more requests or bandwidth). Error rate and uptime move in percentage points, the rest by a relative share.
Below them, charts of requests, response time, CPU and memory over the range; hover one to read a single point. Everything is kept for a year, so All time reaches back at most that far. Traffic starts being recorded when an instance runs this version: Homerun turns Traefik's metrics on by itself (an entrypoint inside the Traefik container, never published), which restarts Traefik once.
#Stacks and the whole instance
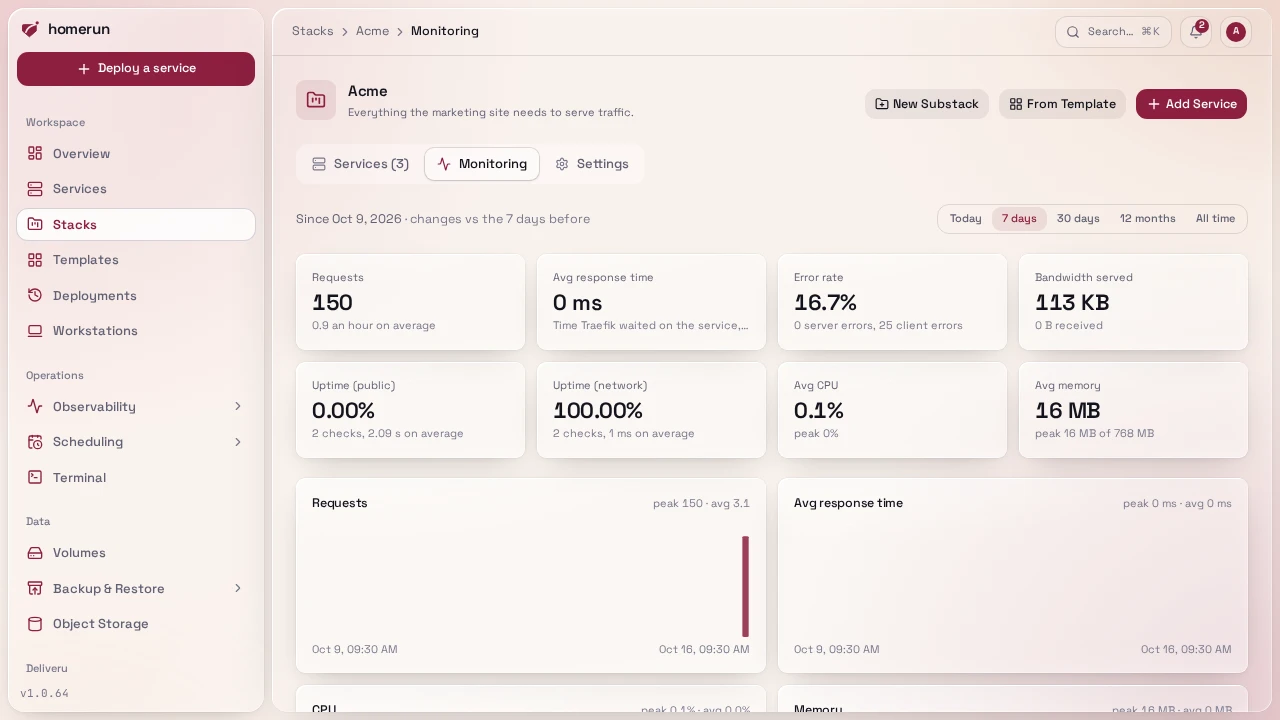
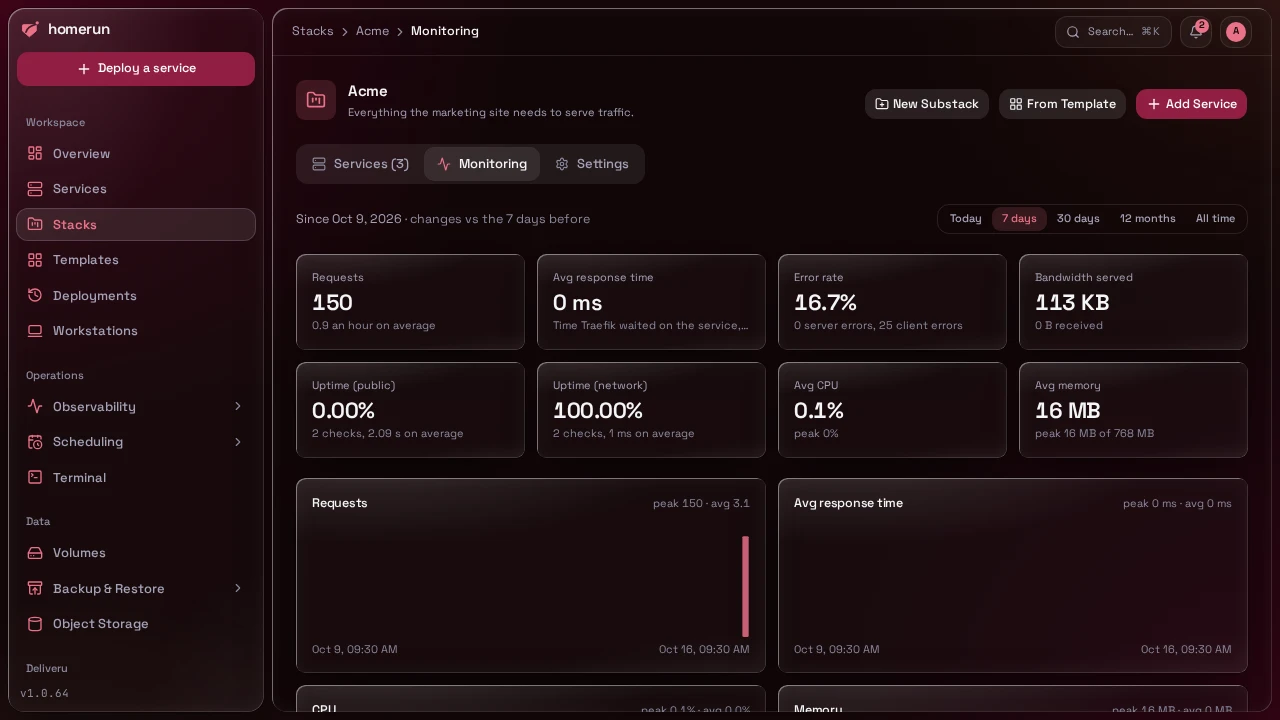
The same view exists one level up. A stack's Monitoring tab covers its services and every substack's: requests, response time, error rate, bandwidth and uptime summed over all of them, and CPU and memory summed minute by minute, so the peak is the stack's real peak rather than the sum of each service's. Monitoring in the sidebar covers every service on the instance, with this host's own CPU and memory instead of the sum of the services'. Both add a By service table, busiest first, that links to each service's own monitoring. The sidebar's Monitoring page also has a Traces tab, the traces of Homerun's own background jobs, and for admins a Blocked IPs tab (see Blocked paths and IP bans), a CrowdSec tab (see CrowdSec) and a Settings tab for the OpenTelemetry collector (see Tracing).
#Uptime
Every minute Homerun probes each deployed service two ways, and the tab draws the recent results as two heartbeat strips with an uptime percentage, latency, and the reason for the latest failure plus hints for fixing it:
- From the network: the container's own port, reached over the Docker network. It runs the service's healthcheck command when it has one, opens a TCP connection for a database image, and makes an HTTP request otherwise.
- From its hostname: the public hostname Traefik publishes
(
<slug>.<base domain>or the service's main domain). It's skipped for a service that isn't DNS-resolvable, and while the base domain is a loopback address likelocalhost, since probing it from this machine proves nothing.
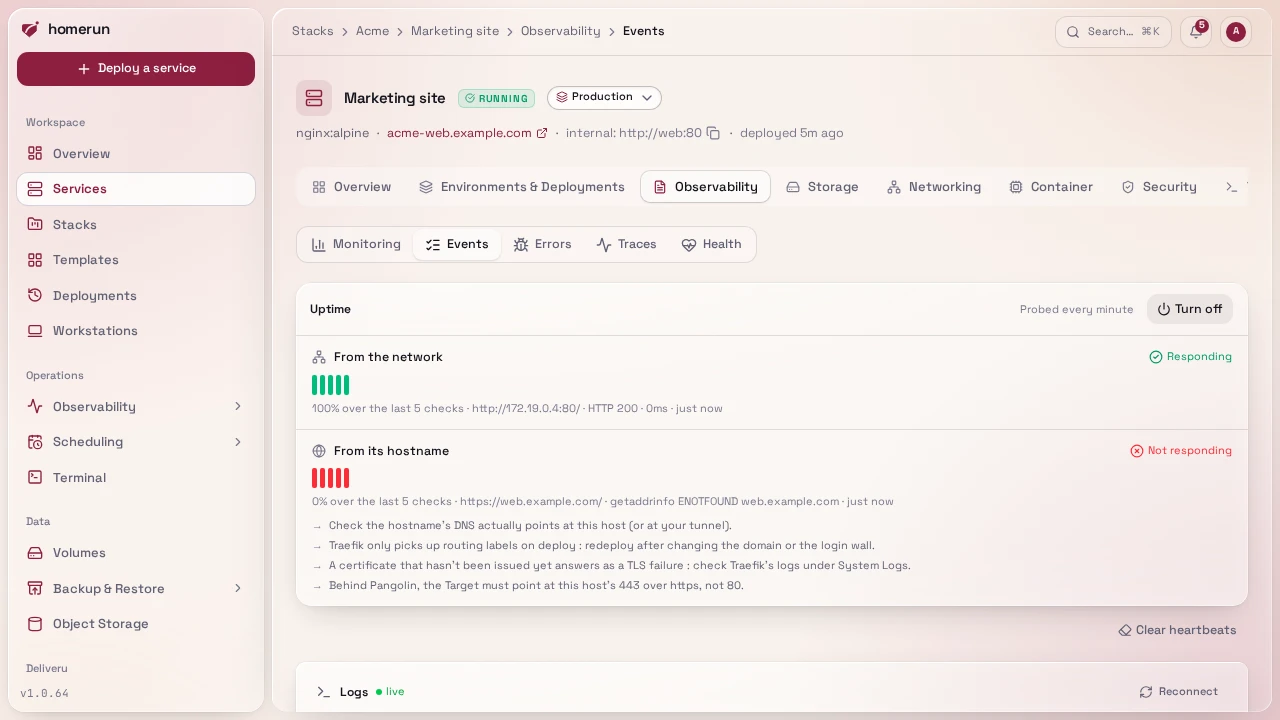
Over HTTP any response under 500 counts as up, a 401 or 404 included, and a 5xx counts as down. Each probe opens a fresh connection and retries a failed connection once after two seconds, so a dropped or reset connection on one request isn't counted against the service. Probing pauses while Homerun disrupts routing on purpose, during its own boot, a Traefik restart and a self-update, so those don't show up as outages.
A probe that fails three checks in a row (about three minutes) fires the Service down event on any notification channel subscribed to it, and Service recovered once it has stayed up for 15 minutes. A failure that clears before then sends nothing. A service that keeps falling over and coming back alerts once, not on every cycle. Results are kept for a week; Clear heartbeats empties the history. Uptime also feeds status pages.
Probing is on by default for every service except databases and caches
(Postgres, MySQL/MariaDB, MongoDB, Redis-compatibles, RabbitMQ, Memcached),
which have nothing public to watch; turn it on for one of those if you want a
TCP check. Turn off in the Uptime panel's header stops both probes for that
service (the panel then says so), Turn on resumes them; the REST API takes
the same switch as uptimeEnabled on PATCH /api/v1/services/:id.
#Logs
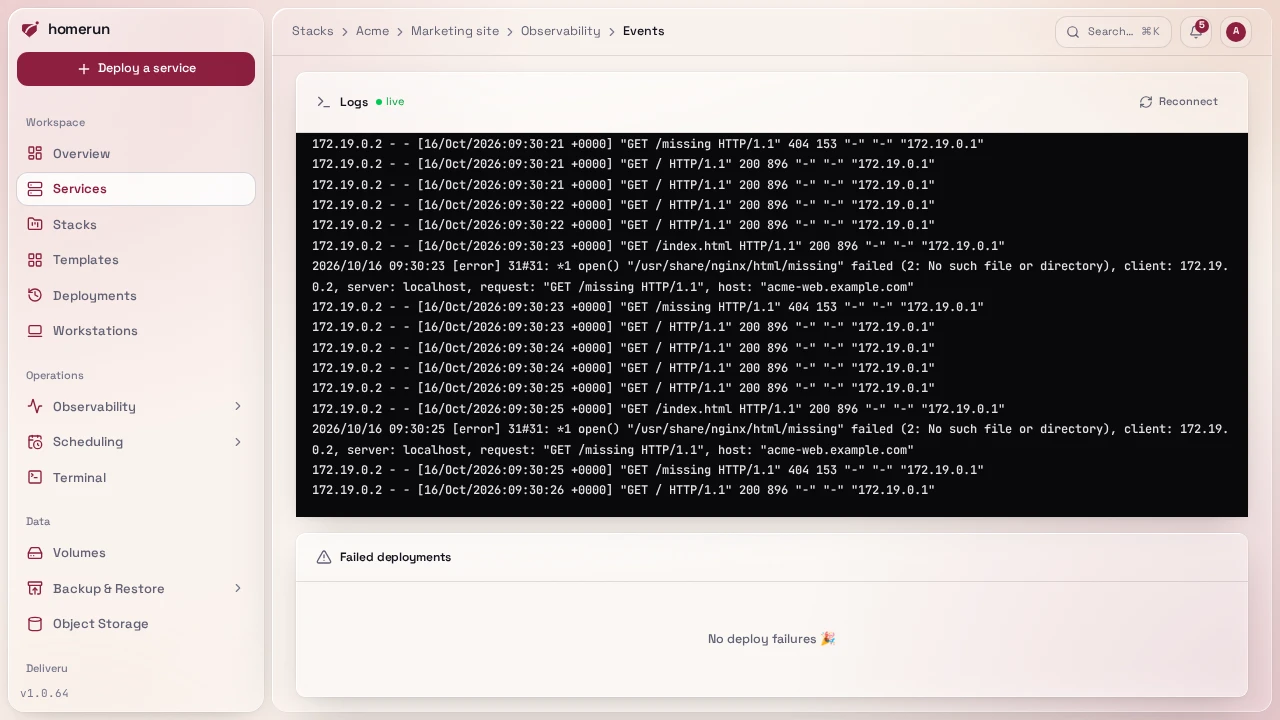
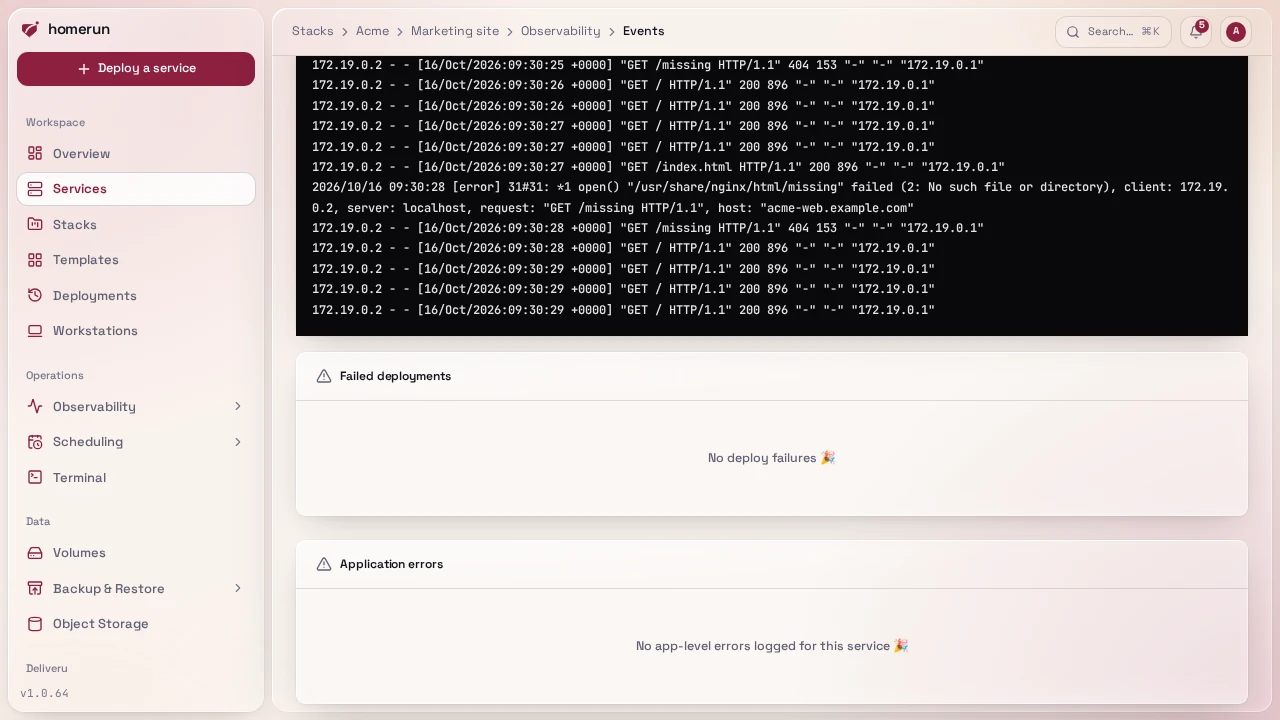
The log panel live-streams a running container's stdout/stderr straight from the browser: the server pushes each line as the container writes it over a long- lived HTTP response, no polling and no WebSocket (SvelteKit has no WebSocket route API; nothing here needs a client-to-server socket anyway). A shorter tail of the same viewer is on the Overview tab once a service has deployed at least once, so recent output is visible without switching tabs.
#Errors
In the Events section, below the logs, Failed deployments and
Application errors (persisted warn/error-level app log lines that mention
this service) sit alongside a "container currently down" banner when the
container has crashed. A deploy that reaches running hides the errors logged
before it, and Clear errors does the same by hand; a note says how many are
hidden and what cleared them, with a link to show them again. If a service's
container was removed outside Homerun (e.g. a manual docker rm), the section
shows a distinct "container is gone" banner with a Resolve button instead:
click it to clear the stale reference so the service goes back to its normal
never-deployed state and Deploy works again.
#Terminal
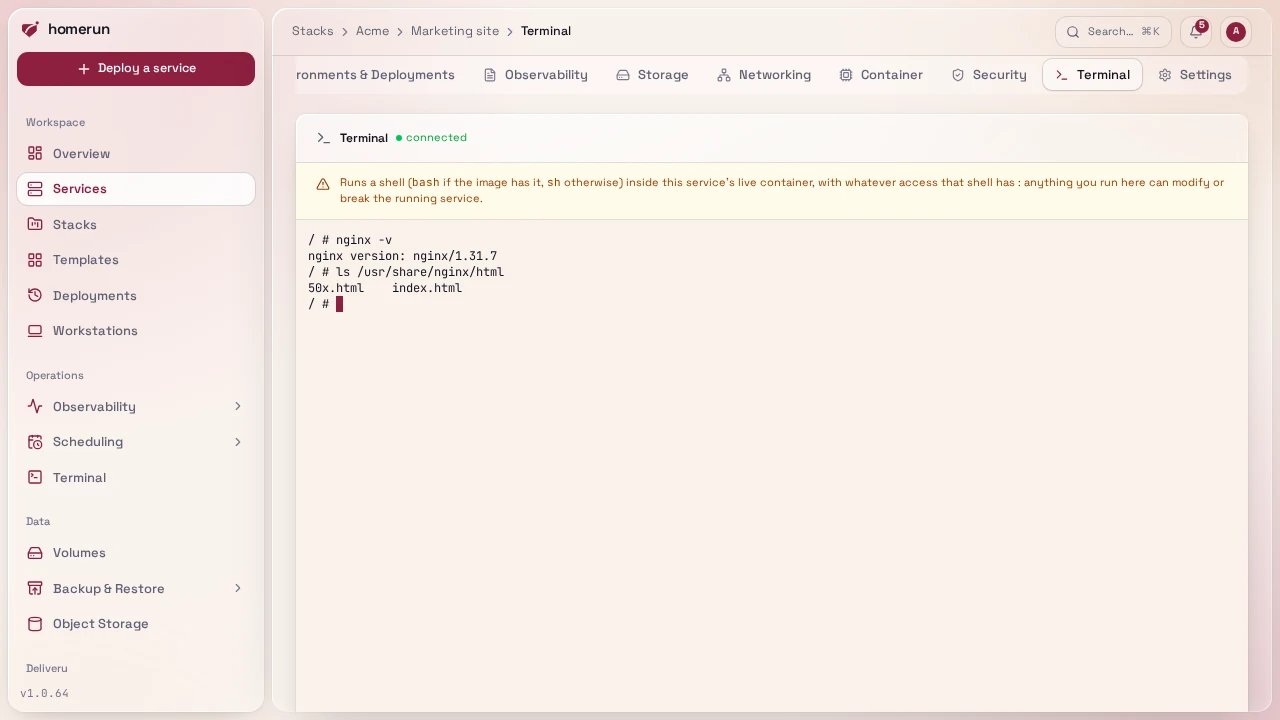
A real terminal into the live container, from the browser, only available while
the service is running. It runs bash when the image has it and sh
otherwise, under a TTY sized to the tab, so colours, tab completion, Ctrl-C and
full-screen tools like vim, top or htop work as they would over SSH. It
follows the app's light/dark theme. Open/close events are logged; individual
keystrokes/commands are not (that's a deliberate scope cut, not an oversight,
raw TTY bytes don't map cleanly to discrete commands anyway).
Leaving the tab (closing it, navigating away, or 15 minutes with no input or
output) ends the session and kills the shell along with everything started from
it, background jobs included: they get SIGHUP, then SIGKILL a second later
if they're still there. Run something meant to outlive the session as a
cron job or in the image itself, not from the
terminal.
This guide lives in the project repo: edit it there, and this page follows within a day.