The dashboard
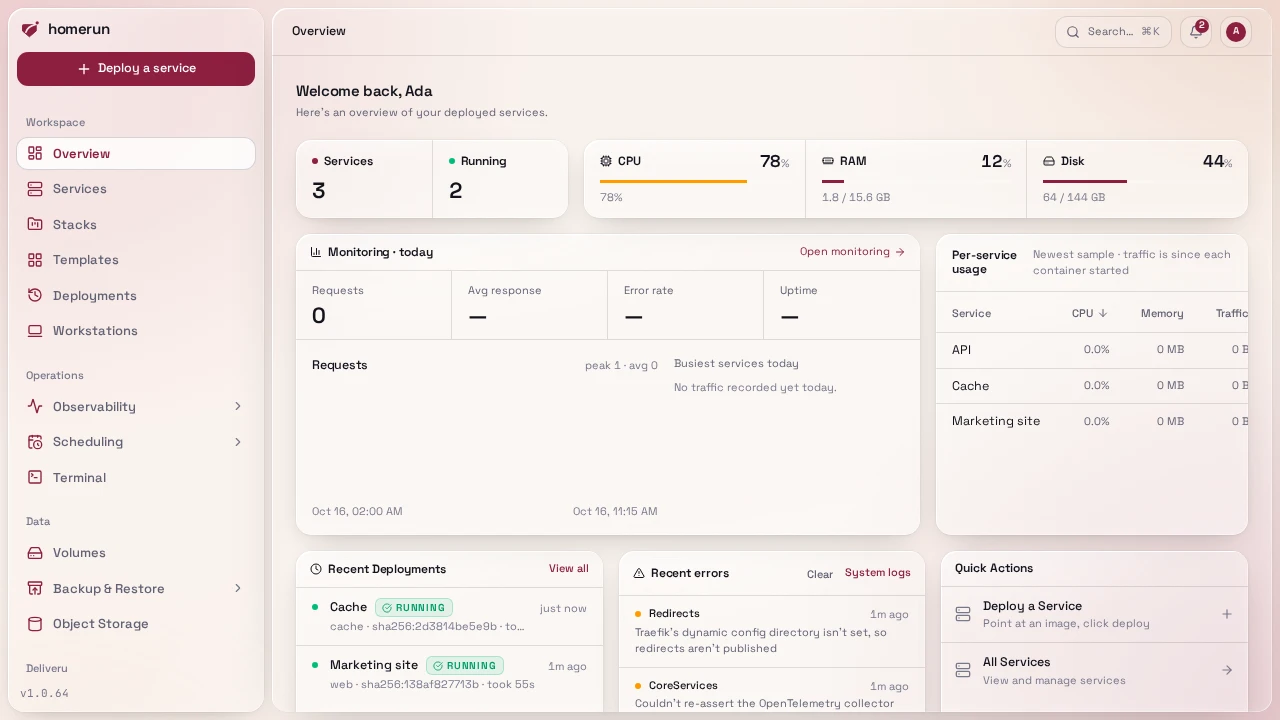
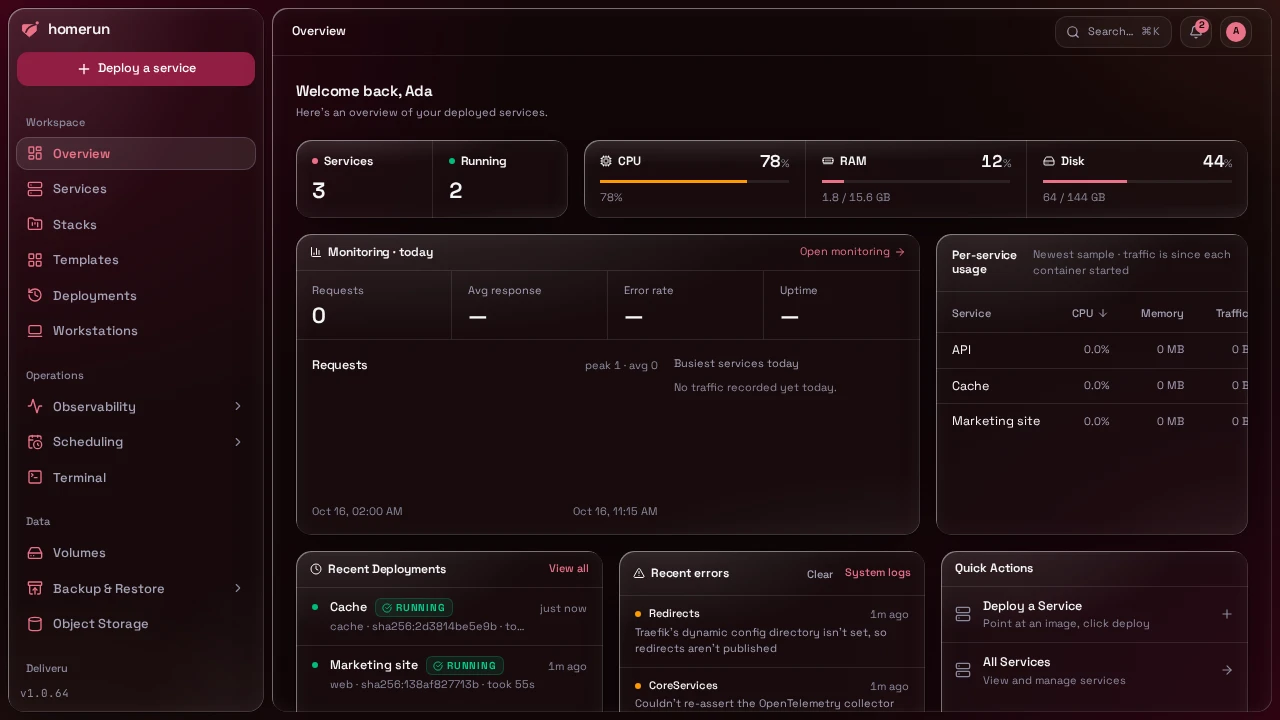
/ (Overview) is the landing page after sign-in:
-
Deploy an app, in simple mode only: popular templates with a Quick Deploy button each, above everything else.
-
Service counts, how many services the instance has and how many are running.
-
Host resources, live CPU, memory, disk and (if an NVIDIA card with
nvidia-smiis present) GPU usage for the machine Homerun runs on, refreshed every five seconds. It loads behind a placeholder rather than blocking the page, so a slowdfnever holds the dashboard up. No card, or nonvidia-smi, just means the GPU block doesn't render, it isn't an error. -
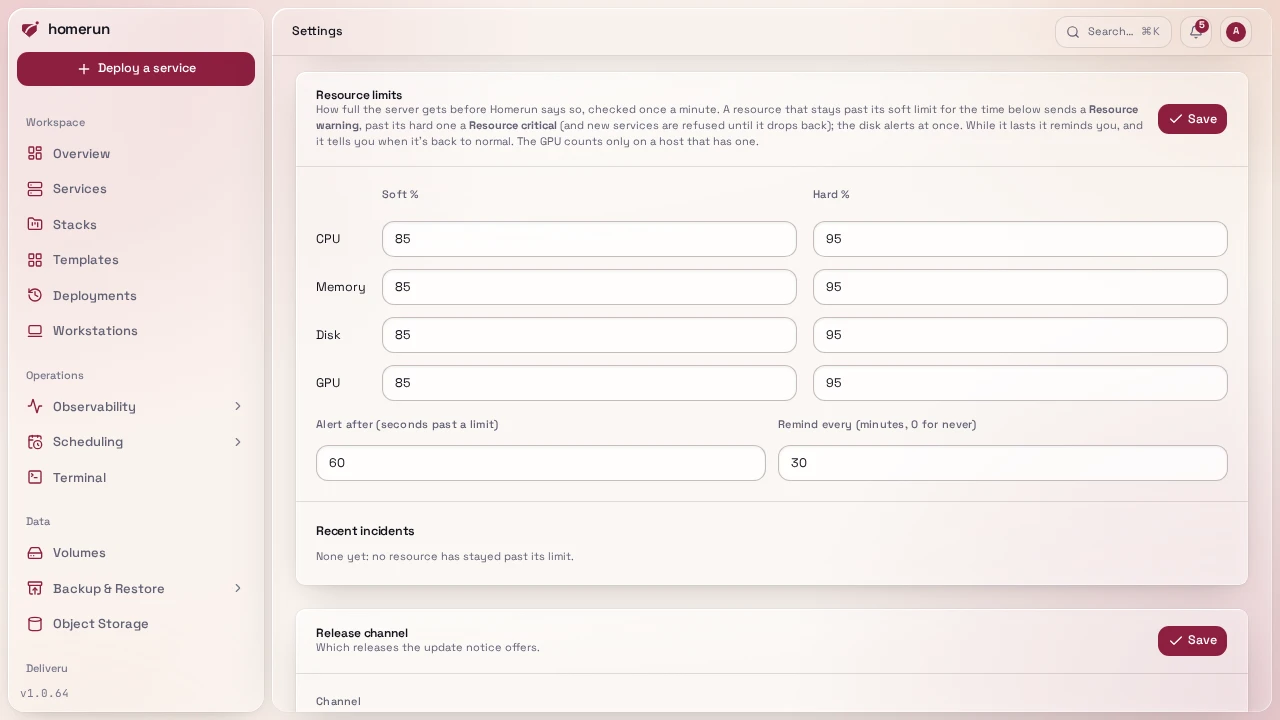
Resource limits: each of CPU, memory, disk and GPU has a soft and a hard threshold (Settings → General → Resource limits, 85% and 95% by default), checked against the host once a minute. A resource only alerts once it has stayed past a limit for a while (Alert after, 60 seconds by default, so a short spike doesn't page you; the disk alerts at once, it doesn't spike), which opens an incident: past the soft limit it sends a Resource warning, past the hard one (or when it climbs there later) a Resource critical, shows a red banner here, and refuses new services (from the wizard, a template, a compose import or migration, the API, or a pull request preview) until usage drops back. While the incident lasts it reminds you (Remind every, 30 minutes by default, 0 for never), and the first reading back under the soft limit sends a back to normal for that resource with how long it lasted and its peak. The last incidents are listed under the limits in Settings, and one still open when Homerun restarts stays open: no second alert, and you still get its recovery. If the host's stats can't be read, nothing is refused.
-
Resource usage history, the same host CPU and memory as a chart, live or over the last hour, day, week, month, year or all of it, from a sample taken every minute and kept for a year, next to a per-service usage table of the five services using the most (sort it by CPU, memory or traffic). A stack's own page has the same table for its members, and a service's Overview tab has its own chart.
-
Recent deployments across every service, each linking to the service it belongs to; View all opens the full deployment history.
-
Recent errors, the latest warn/error-level log lines, each linking to the service it mentions (or to System Logs when it mentions none). An admin sees the instance's most recent errors, including ones that mention no service; a developer only sees ones that mention a service.
-
Quick actions, shortcuts to deploy a service and to the services list.
-
A setup-issues banner, when applicable, see below.
#List pages
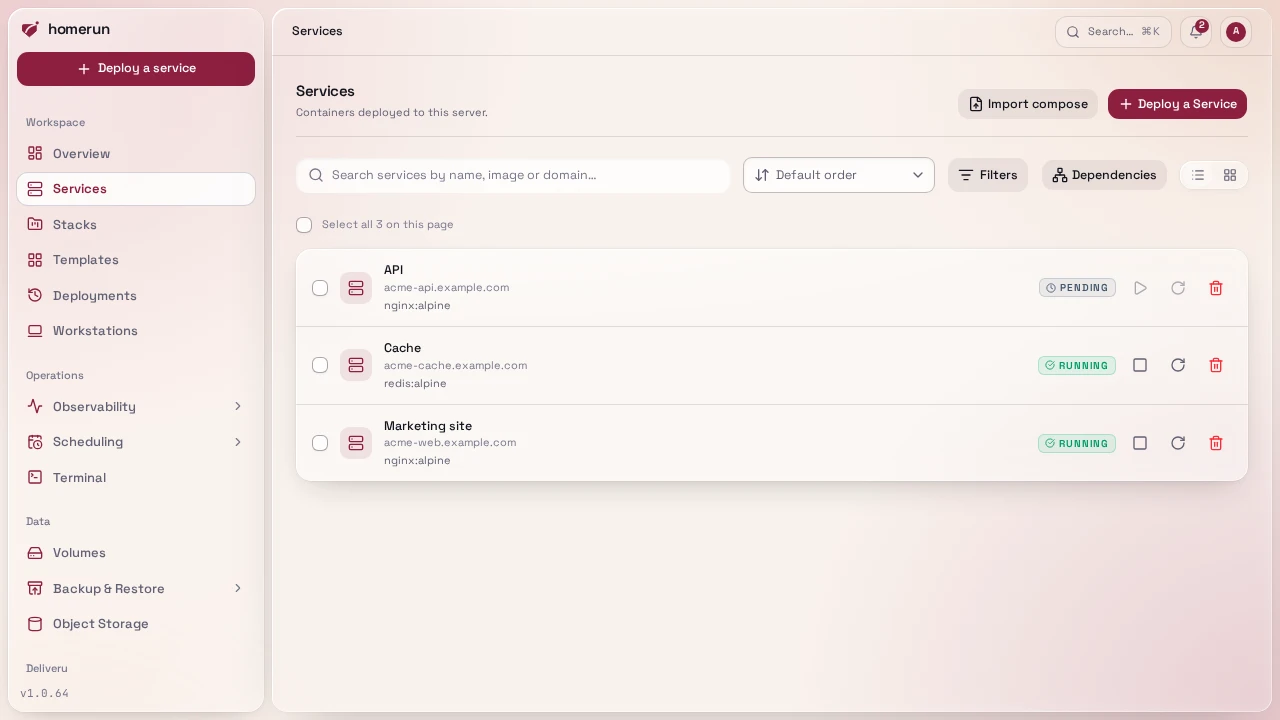
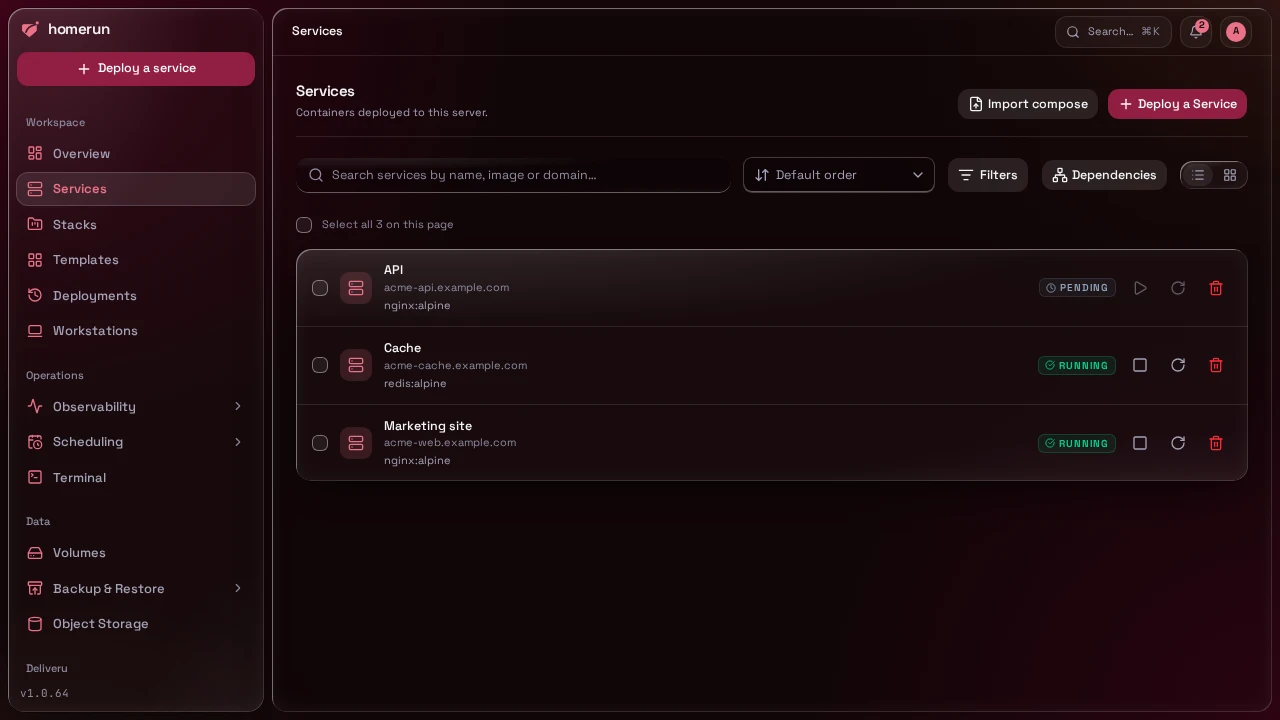
Every list page (services, stacks, templates, cron jobs, storage, remote hosts, build cache registries, backup destinations, users) has the same toolbar: a search box, a sort (newest, oldest, name A–Z or Z–A, recently updated, and most services on stacks), filters where the list has any, and a pager. All of them run on the server over everything you can see, and live in the URL.
#Search
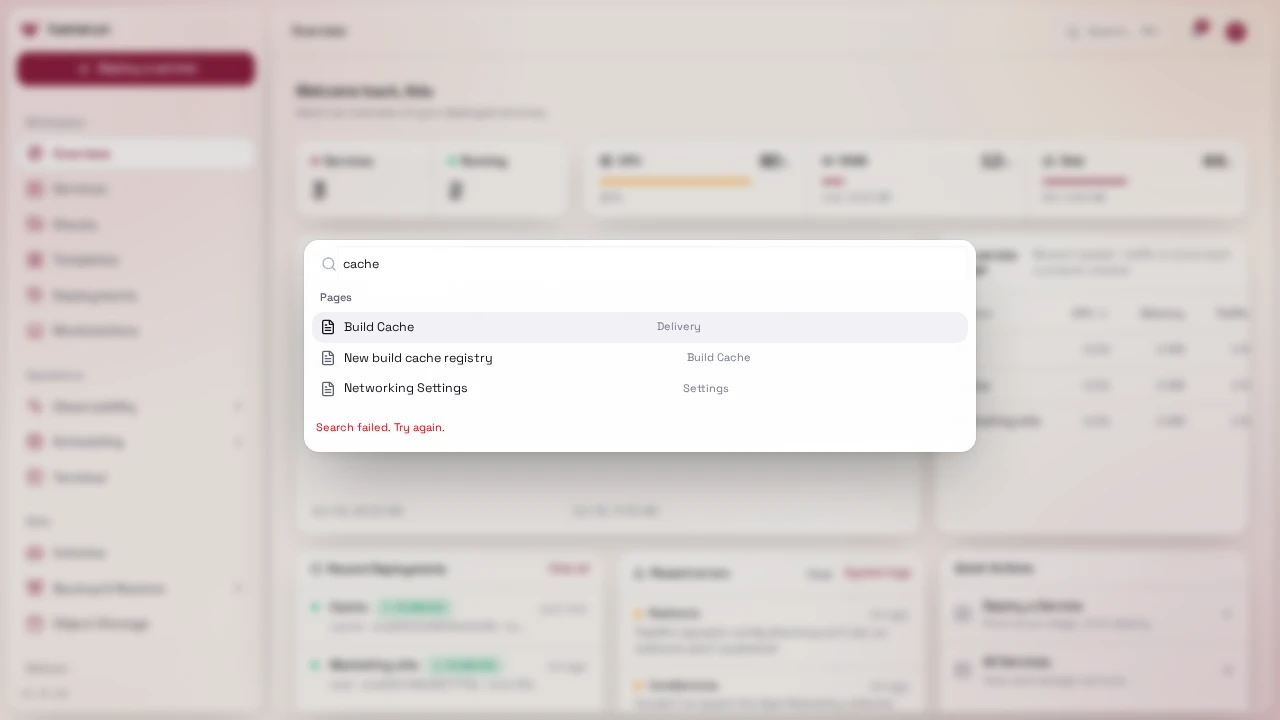
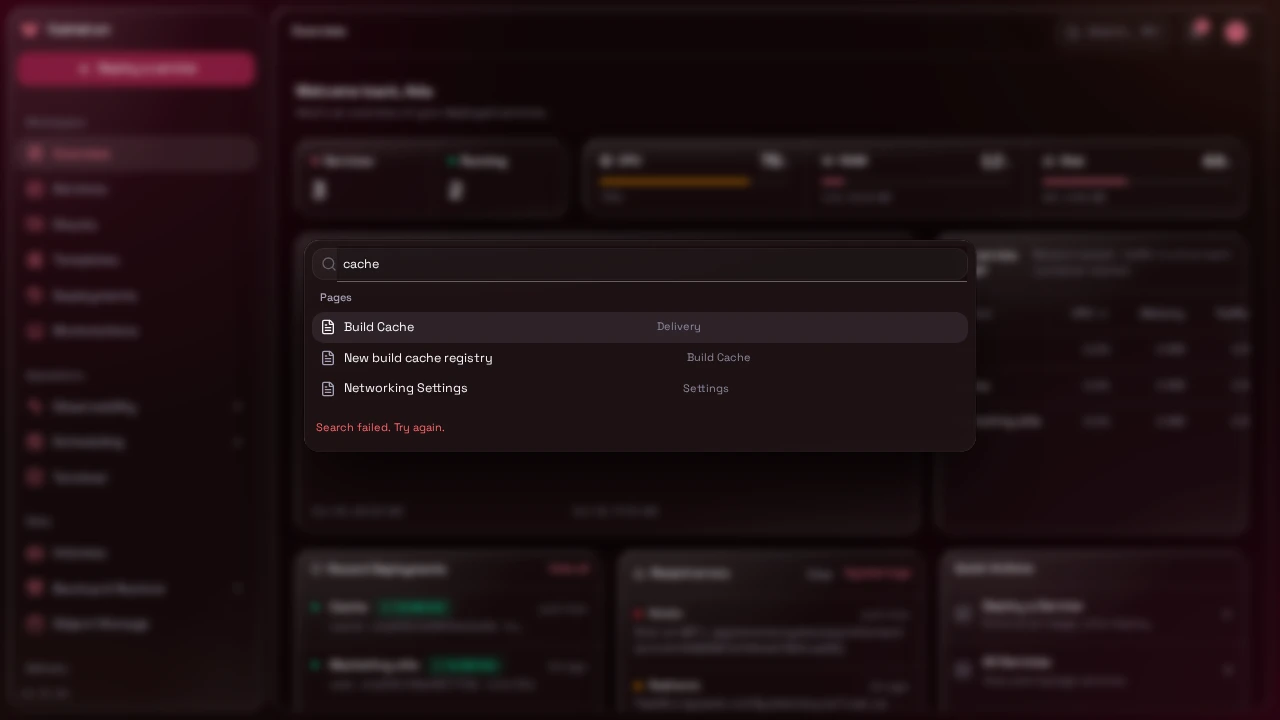
The Search… button in the header, or ⌘K / Ctrl+K anywhere, opens a
command palette. It jumps to any dashboard page by name, and once you've typed
two characters it also searches the instance's services, stacks, templates, cron
jobs, storage volumes, backup destinations, remote hosts, build cache
registries, git providers, notification channels and status pages, plus users
and authentication providers for an admin.
#Setup diagnostics
Homerun runs a handful of read-only checks on every dashboard load: base domain and auth secret still at their defaults, no Dashboard URL set, the dashboard's own hostname actually routed to it by Traefik, the Traefik container reachable, the worker reachable and the Docker socket it fronts answering, Traefik still running with the flags your settings put on it (the swarm provider, the HTTP cache plugin, the ACME email), Docker not stuck on a helper container (see Docker stuck on a container), and SMTP fully configured if you turned it on. The worker and Docker checks are reported separately on purpose: a worker that's down and a worker that's up but can't reach Docker are different problems with different fixes. Any that aren't OK show up as a banner at the top of the dashboard.
The banner links straight into /settings, on whichever tab the offending field
lives, and rings the relevant fields so you can see what it's complaining about
rather than hunting for it. Two checks have nothing to deep-link to: the auth
secret is env-only (AUTH_SECRET, change it and restart), and the Traefik
checks are about a live container rather than a setting. When Traefik has lost
flags your settings put on it, usually because it was recreated from the compose
file, an admin gets a Re-apply button that puts them back (Traefik restarts,
so routes drop for a few seconds). Homerun also re-applies them on its own every
time its worker starts.
There's no separate /setup page, the banner plus /settings is the whole
flow.
This guide lives in the project repo: edit it there, and this page follows within a day.