Error tracking
Advanced mode: simple mode hides the Errors section of a service's Observability tab. Everything here keeps working either way, and a hidden page still opens from a link.
Homerun can collect the errors your apps throw, group them into issues, show each one's stack trace next to the source code that raised it, and tell you through your notification channels when a new issue appears or a resolved one comes back. It speaks the Sentry protocol, so you use an official Sentry SDK (Node, Python, Go, Ruby, PHP, Java, browser JavaScript…) unchanged and point it at Homerun instead of sentry.io.
#Turning it on
Open a service's Observability → Errors section and turn on Error tracking. Homerun creates a project for the service and shows its DSN, with setup snippets for the common SDKs:
https://<public key>@homerun.example.com/<project id>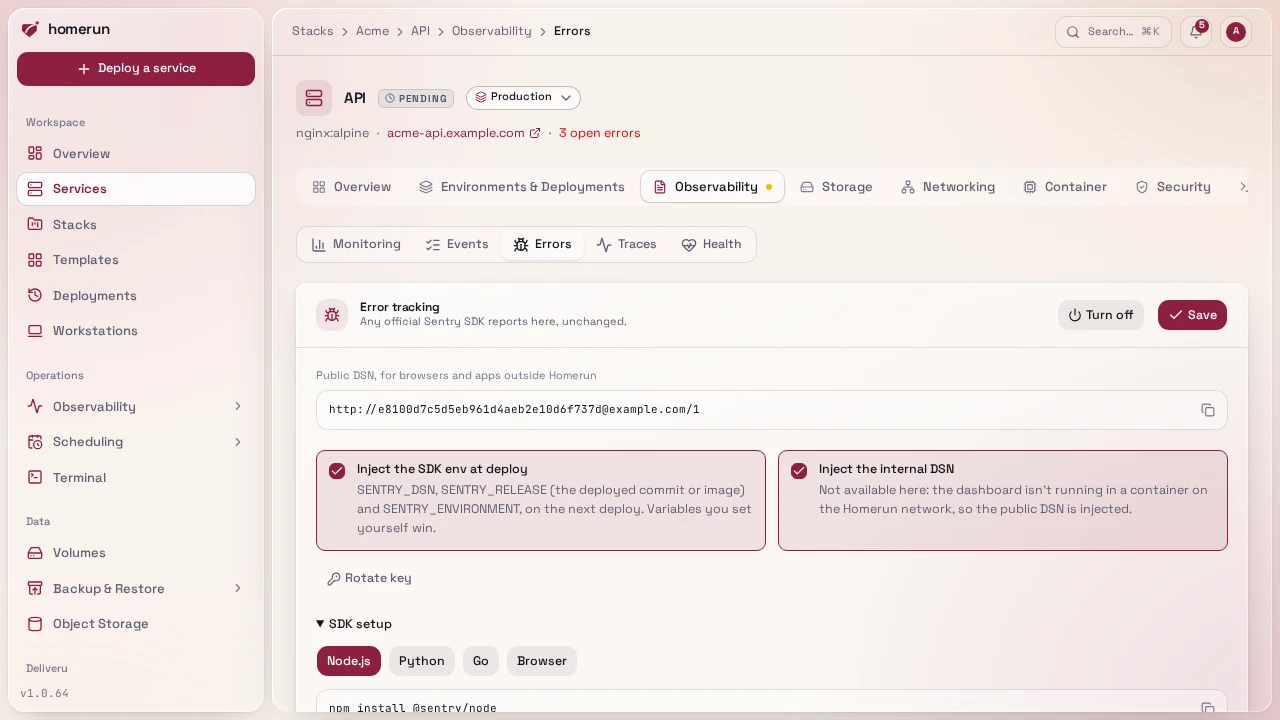
With Inject SENTRY_DSN, SENTRY_RELEASE and SENTRY_ENVIRONMENT on (the default), the next deploy adds those three variables to the service's env, so the app only needs to initialise the SDK with no arguments:
SENTRY_DSNpoints at the dashboard container over the Homerun network (plainhttp://to its network alias), so the app doesn't need to reach the dashboard's public URL. The public DSN in the section is for anything outside the host, such as a browser.SENTRY_RELEASEis the git commit the deploy built, or the image reference for an image service, so every event says exactly which code raised it.SENTRY_ENVIRONMENTis the service's environment (production, a custom name,canaryorpreview).
A variable the service already sets itself is never overwritten. Pull request
previews and the release-channel canary report to their parent's project, with
preview or canary as their environment, so you see every environment's
errors in one place.
The Dashboard URL (Settings → General) has to be set for the public DSN to show.
#Issues
Events that are the same error are grouped into one issue, with a count and the first and last time it was seen. Events are grouped by:
- the
fingerprintthe SDK sends, when it sends one ({{ default }}in it stands for the grouping below); - otherwise the exception type and the app's own stack frames (function, module and file, ignoring line numbers, so a small edit elsewhere in the file doesn't split the issue);
- otherwise the message, with numbers, ids and hex addresses ignored.
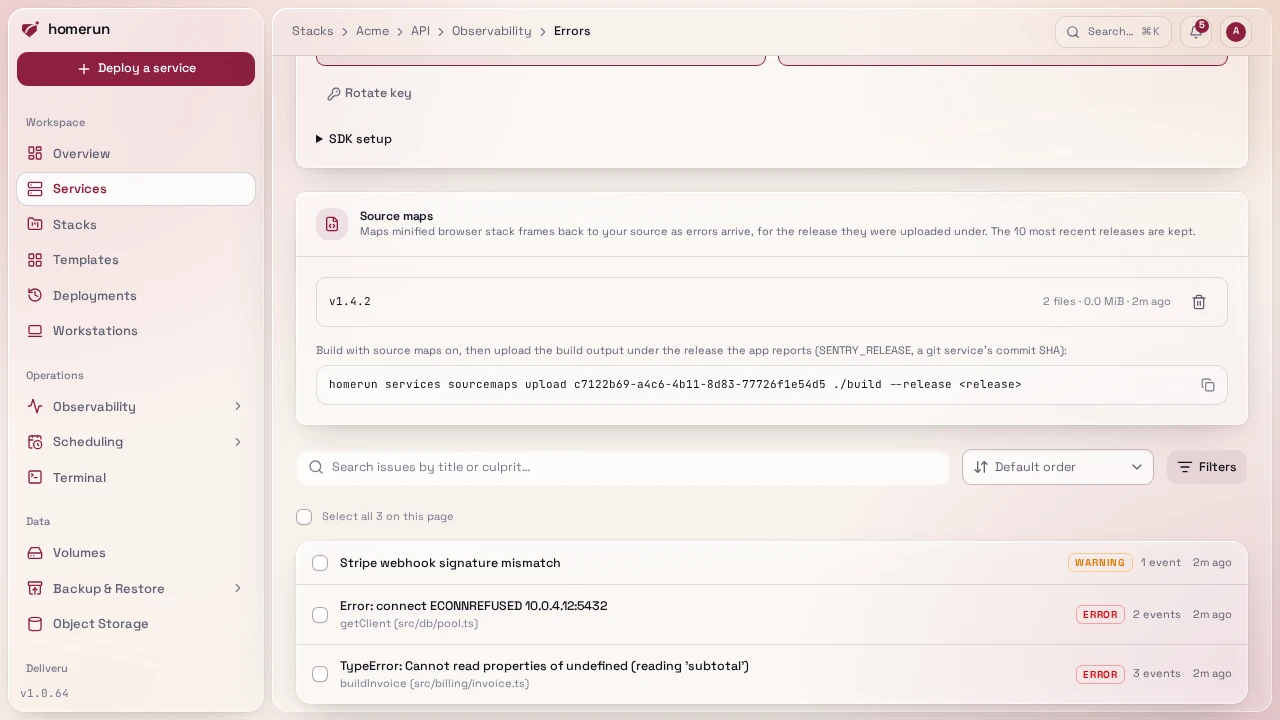
An issue is unresolved, resolved or ignored. Resolve one once you've shipped a fix; if it happens again it's regressed: it goes back to unresolved and you're notified. An ignored issue still counts its events but never notifies. The Errors section lists issues with a status filter and search, and resolves or ignores several at once.
#Back to the source
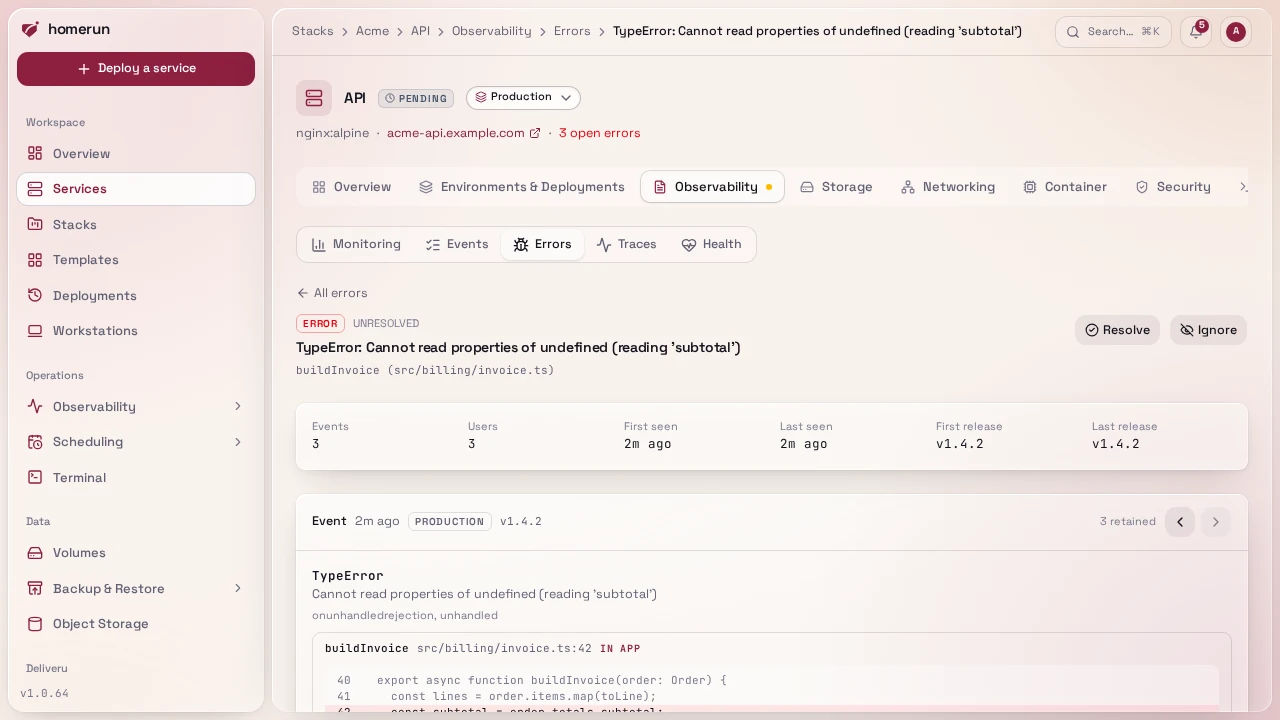
An issue's page shows the exception (and the chain of exceptions that caused it), its stack trace with your own frames open and library frames folded, the lines of code around each frame when the SDK sends them (most server-side SDKs do), plus the request, user, tags and breadcrumbs of the event, and the other events of the issue: the arrows step to the older or newer one, and each event has its own link to share.
For a service linked to a repository under Pipelines, or built
from a git repository, each of your own frames has a View in repo link to
that file and line at the exact commit that ran: the event's release when it's a
commit, otherwise the deployment that was live when the event happened. A
service that runs an image and has nothing deployed from the repository links to
its default branch instead, unless its SDK sends the commit as the release. A
linked repository takes precedence over the one a git service builds from. Build
directories such as /app/, /usr/src/app/ or /workspace/repo/ are stripped
to get the path inside the repository. GitHub, GitLab, Gitea and Bitbucket URLs
are supported.
#Source maps
Browser JavaScript is minified, so its stack traces point at
https://app.example.com/_app/immutable/app.3f2a.js:1:48213 in a function named
t. Upload the build's source maps and Homerun maps those frames back to the
original file, line, function name and surrounding source as each error arrives
(and groups issues on the real function names).
-
Build with source maps on:
build.sourcemap: truein Vite (SvelteKit, Vue, React with Vite),productionBrowserSourceMaps: truein Next.js,devtool: "source-map"in webpack. -
Upload the build output under the release the app reports, the
SENTRY_RELEASEit sends (Homerun injects the commit SHA for a git service):homerun services sourcemaps upload <service id> ./build --release <release>Every
.mapfile under the directory is sent under its path relative to it, which has to be the path the minified file is served at (./build/_app/x.js.mapcovershttps://<app>/_app/x.js). The API equivalent is a multipartPOST /api/v1/services/{id}/sourcemapswith areleasefield and one field per map named after its path.
Maps apply to errors that arrive after the upload; errors already stored keep
their minified frames. The service's Errors section lists the releases with
maps, and deletes one; homerun services sourcemaps list <id> and
homerun services sourcemaps delete <id> <release> do the same. Only the 10
most recent releases are kept, and a map can be at most 25 MiB. A map doesn't
need to be served publicly, so you can keep it out of the deployed image.
#Notifications
A new issue sends the error.issue.new event and a regression sends
error.issue.regressed, both to the in-app notifications and to every
notification channel subscribed to them, with the service,
the error, its location, its count and a link to the issue. At most 10 of each
are sent per service per hour, so an app stuck in an error loop can't flood a
channel; new issues and regressions have separate allowances, so a burst of new
issues never hides a regression.
#Limits
- An event body is at most 1 MB, and each project takes at most 120 events a
minute. Past that the SDK is told to back off (
429withRetry-After), the standard Sentry rate-limit answer. - Stack traces are trimmed to 60 frames and 5 chained exceptions, breadcrumbs to the last 50, and long values are shortened.
- Each issue keeps its latest 100 events. Events older than 30 days are deleted, and so are resolved or ignored issues with nothing newer.
- Only errors are stored. Performance traces, sessions, replays and attachments are accepted and dropped, so SDKs that send them don't retry.
- Minified browser JavaScript is only mapped back to its source once its source maps are uploaded. Server-side stack traces are shown as sent.
#From the API, CLI and MCP server
GET /api/v1/services/{id}/errors lists a service's issues,
GET /api/v1/services/{id}/errors/{issueId} returns one with its latest event,
and PATCH on it changes its status. The CLI has
homerun services errors <id>, and the MCP server list_errors and
get_error, so an assistant can read the stack trace while it debugs. See
API & CLI.
This guide lives in the project repo: edit it there, and this page follows within a day.